-Evaluation of the accuracy of power measuring units using a calibration system based on the national standards –
Masahiro Murakawa (Leader) of Smart Grid Research Group, the Information Technology Research Institute (Director: Satoshi Sekiguchi) of the National Institute of Advanced Industrial Science and Technology (AIST; President: Tamotsu Nomakuchi) and Seitaro Kon (Researcher) of Electricity and Magnetism Division, Metrology Institute of Japan (Director: Yukinobu Miki) of AIST and others, have developed an inexpensive power measuring unit. In the computer server room of AIST they have installed a power visualization system that uses the power measuring units. The system allows detailed visualization of the power consumption of each server installed in the room and is expected to contribute to the reduction in power consumption.
The new power measuring unit can measure power consumption at four measuring points simultaneously. It consists of commercially available clamp current sensors and an inexpensive one-chip microcomputer and can therefore be produced at low cost (about 2,500 yen per measuring point when it is mass produced). The researchers have also developed a calibration system based on the national standards. The calibration system can guarantee the accuracy of power measuring units. They used the calibration system to evaluate the developed power measuring units and found a measurement error of about 1%, indicating that the units have sufficient accuracy for use in a power visualization system, despite their low cost. In addition, they have developed a power visualization system to collect and store power measuring unit readings on a cloud server on the Internet. Using a cloud server (Google App Engine), they rapidly developed the system that makes measurements at a total of 249 measuring points and visualizes the power consumption of each computer server.
It will therefore be possible to develop similar power visualization systems, which can guarantee the accuracy of measurements, at low cost and in a short period of time. The developed visualization technology can be applied to power visualization systems that can visualize in detail the power consumption of each machine in a factory and is expected to help reduce power consumption in offices and factories. To reduce the power consumption of an entire data center, the researchers plan to develop technology to visualize the power consumption of each server and automatically and efficiently control the number of servers to be operated according to changes in the power consumption and the workload of the data center.
 |
 |
|
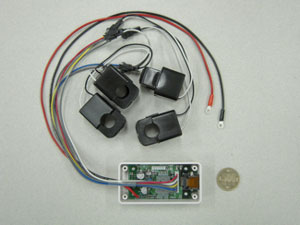
Figure : The developed power measuring unit (left: overall view; right: signal processing unit, dimensions: W90 mm × D45 mm × H25 mm) |
To address the power shortages that have occurred since the Great East Japan Earthquake, under Article 27 of the Electricity Business Act the Government has issued an order to restrict the use of electricity in the service areas of the Tokyo Electric Power Company, Inc. and Tohoku Electric Power Co., Inc. Large customers (more than 500 kW contract demand) are required to cut power consumption by 15% compared with that of the previous year. To meet this requirement, such customers have a wide range of measures in place to reduce power consumption, including simple power-saving actions such as turning off lights when not in use, shutting down operations in rotation, changing production plans, and relocating resources at business premises including information systems. Because it is essential in developing power-saving measures to know when, where, and how much power is being used, the use of power visualization systems at individual premises and factories is spreading. In order to develop a detailed power-saving plan, it is necessary to visualize zone-by-zone power consumption on the level of individual distribution boards or circuit breakers in a building. However, this requires a large number of power measuring units and the issue is the cost of these units.
Data obtained with a power visualization system can be used for billing and calculating production costs, but guaranteeing the accuracy of measurements made with power measuring units is an issue.
Since FY2010, AIST has been developing a power measuring unit calibration system traceable to the national standards. In April 2011, the researchers started developing a power visualization system at a distribution board level, using the new calibration system to help AIST develop a power-saving plan after the Great East Japan Earthquake of March 2011. The development of the power visualization system is based on the following four principles: (1) launch the system in a short period of time before the summer of 2011, when power shortages will peak; (2) develop a system that uses existing technology and works reliably; (3) develop a power measuring unit that uses inexpensive, commercially available electronic components and is as inexpensive as possible; and (4) make the design scalable so that measuring points can be easily added later. On the basis of these principles, they determined the overall configuration of the system and started developing the components.
To reduce power consumption, AIST plans to have its major computer servers in one computer server room. The reason for this is that if the servers are located in several locations, distributed air-conditioning and ventilation systems should be operated independently to remove heat from the servers, and this is inefficient. The researchers used the new power measuring unit to measure the power consumption of each of the servers located in the computer server room, and the developed system allows server users to visually check the power consumption of the server in real time.
 |
|
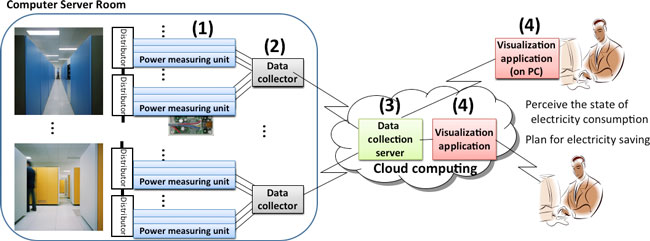
Figure 1 : Overall configuration of the power visualization system |
The system shown in Fig. 1 consists mainly of four types of components that the researchers have developed: (1) power measuring units, (2) data collectors, (3) a data collection server, and (4) visualization applications. The system measures power consumption at 249 measuring points using 66 power measuring units (some units do not measure power consumption at all four measuring points due to their layout) and four data collectors. The characteristics of each of the developed components are described below.
(1) Power measuring unit and provision of traceability
The power measuring unit consists of a power metering board (Fig. 2) and current sensors, up to four of which can be connected to the board. It can measure power consumption at up to four points if the power supply is single-phase 100/200 V. For three-phase 200-V power supplies, which are commonly used by large machines in factories, the system can measure power consumption at up to two points by combining two current sensors. The current sensors used are commercially available clamp current sensors. Current is measured by clipping the sensor to the cable to be measured. The power metering board calculates the power consumption by sampling via the current sensor 6400 times a second. This allows accurate measurement, even if the current waveform is disturbed by high-frequency noise. The calculated power consumption is sent to the data collector every second.
The power metering board uses an improved signal processing technique and serial communication to communicate with the data collector. This allows the use of an inexpensive general-purpose one-chip microcomputer and low-cost production of the board. The board can be mass produced at about 10,000 yen (about 2,500 yen per measuring point), including the current sensors.
 |
|
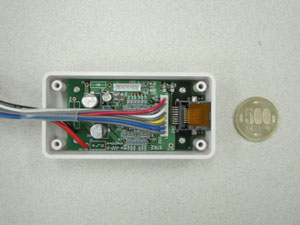
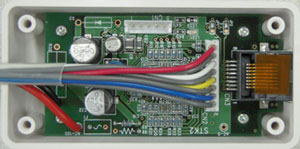
Figure 2 : Power metering board |
 |
|
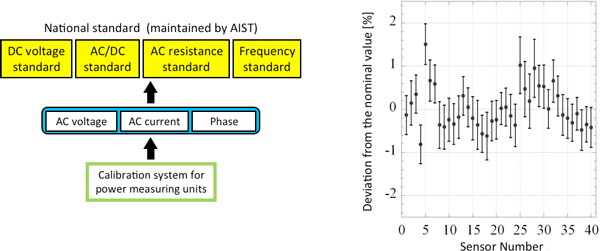
Figure 3 : Schematic of traceability (left) and evaluation results of the power measuring units (right) |
Figure 3 (left) is a schematic of the traceability of the power measuring unit. The developed calibration system is traceable to the national standards and can guarantee the accuracy of measurements with the power measuring unit evaluated using the system.
Figure 3 (right) shows the results of the evaluation of 10 sampled power measuring units (40 current sensors) using the calibration system. The power measuring units were evaluated at a nominal input power of 500 W (voltage: 100 V; current: 5 A; power factor: 1; frequency: 50 Hz) and at room temperature (23±1 ºC). The graph shows deviation of the measurements using the power measuring units from the nominal value. Although there are some variations in the results, the deviation is about 1% and meets the performance criteria (less than 2%) generally applicable to power meters.
(2) Data collector
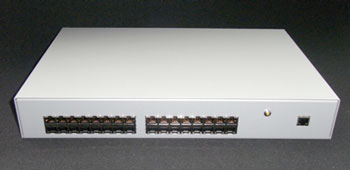
If power consumption data from the power measuring unit are sent directly to the data collection server on the Internet, the number of communications between the power measuring unit and the server increases. Therefore, the researchers designed the system so that the power consumption data are collected first by the data collector and then sent to the data collection server as a group after a given amount of time. Up to 32 power measuring units can be connected to the data collector shown in Fig. 4. The data collector collects the power consumption data sent every second from each power measuring unit. It shapes and stores the collected data and then sends them as a group to the data collection server on the Internet every 20 seconds.
The power measuring units are connected by generic LAN cables (using RJ-45 connectors) to the data collector. The data collector receives data by serial communication and supplies power to the power measuring units through signal cables that are not used for communication. This eliminates the need to install a separate circuit to supply power from a wall outlet when installing the power measuring units, making it possible to reduce the installation time and cost.
 |
|
Figure 4 : Data collector (size: W400 mm × D250 mm × H60 mm) |
(3) Data collection server
The data collection server compiles power consumption data sent from the data collectors and stores the power consumption at all measuring points in a database. Google App Engine was used as the server in this study. Use of a cloud server makes it possible to develop a system that collects measurement data obtained at 249 measuring points in real time, to store them in a database, and put the system into operation in a time period as short as 3 months. The data collection server can easily accommodate expansion of the system.
(4) Visualization applications
The visualization application allows the user to download power consumption from the database on the data collection server and visually check it. The researchers have developed a simple REST protocol for downloading from the data collection server to allow various applications, such as Web applications and Windows applications, to be connected to the visualization system.
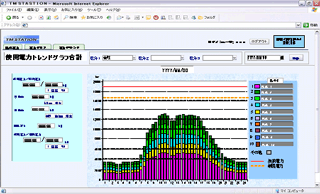
In this study, the researchers connected the visualization system to the Power-consumption Visualization Cloud Service (Fig. 5) provided by Toshiba Solutions Corporation through the research collaboration with the corporation. This service is used to present half-hourly power-consumption data in a graph on a Web browser and makes it easy to grasp trends in power consumption.
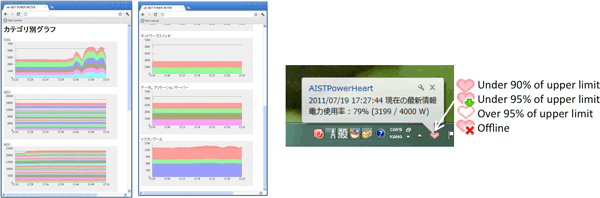
For a more detailed analysis of power consumption, the researchers have developed an application that presents power-consumption data in a graph every minute. They have also developed a Windows application that allows the user to easily check current power consumption on a PC (Fig. 6).
 |
|
Figure 5 : Screen shot of Power-consumption Visualization Cloud Service of Toshiba Solutions Corporation |
 |
|
Figure 6 : Examples of visualization applications |
Left: A graph of minute-by-minute power consumption that can be viewed on a Web browser.
Right: An application displayed in the Windows task tray that allows the user to easily check power consumption |
|
The power consumption of each server in the computer server room is now visualized. In the next step, the researchers plan to visualize the cost of air conditioning for the computer server room and to graphically present the cost corresponding to the power consumption of each server to the user of the server. They aim to raise awareness of power saving among server users to reduce power consumption.
The present study has shown that a system for visualizing in detail the power consumption of each machine in offices and factories, where many machines of various types are used, can be developed at low cost in a short period of time. The power visualization technology is expected to help large customers to reduce their power consumption.
The researchers also plan to use the new power-consumption information collection technology to reduce the power consumption of data center equipment by using power cut-off controls. This is a combination with a technology to control power consumption by automatically increasing or decreasing the number of pieces of equipment operating in accordance with changes in the workload of a data center. Further improvement in efficiency and reduction in power consumption are expected in the following manner. When the load drops it is concentrated on some servers quickly and the other servers are shut down to reduce the overall power consumption of the data center. The power consumption of each server is fed back in real time to the scheduling of load concentration.