Update(MM/DD/YYYY):06/18/2021
Investigation into preventing COVID-19 infections at J.League stadiums and clubhouses (first report)
-Investigation details and measurements of CO2 concentrations and congestion in stadiums-
Researchers) YASUTAKA Tetsuo, NAITO Wataru, SHINOHARA Naohide, ONISHI Masaki, BANDO Yoshiaki
Key points
- Measured CO2 concentrations in 5 stadiums to evaluate congestion and ventilation
- Evaluated congestion and closed-space settings around gates at the Japan National Stadium using data obtained by lidar
- Found CO2 concentrations in stadium seating areas were between 400 and 700 ppm
- Excluding post-match periods, Japan National Stadium concourses were most crowded one hour prior to kickoff
Overview
The National Institute of Advanced Industrial Science and Technology (AIST) of Japan, the Japan Professional Football League (J.League), and 6 J.League clubs have partnered together to investigate the prevention of COVID-19 infections at stadiums and team clubhouses. The investigation was conducted at 5 stadiums during J.League matches and the final of the Levain Cup and also in team club houses. It involved evaluating the risks of infection posed to spectators, players, and stadium personnel. The evaluation was conducted by measuring CO2 concentrations as an indicator of the ventilation or closed/crowded settings and also by using lidar, image sensors, acoustic sensors, and other devices to evaluate crowd congestion; the degree of close contact; and spectator behavior. These evaluations were in turn used to quantify the degree to which the so-called “Three Cs” were manifested at these sites. (The Three Cs in Japan are easy-to-understand situations or combinations thereof that should be avoided to reduce the risk of infection. The situations to avoid are as follows: poorly ventilated Closed spaces; Crowded spaces; and settings where there is Close-contact between people.)
The partnership is more specifically between AIST (chairperson: ISHIMURA Kazuhiko); AIST Resource Geochemistry Research Group (research group director: YASUTAKA Tetsuo); AIST Institute for Geo-Resources and Environment Research (research division director: MITSUHATA Yuji); AIST Risk Evaluation Strategy Group (research group director: NAITO Wataru and lead researcher: SHINOHARA Naohide); AIST Research Institute of Science for Safety and Sustainability (research division director: OGATA Yuji); AIST Social Intelligence Research Team (research team director: ONISHI Masaki and researcher: BANDO Yoshiaki), AIST Artificial Intelligence and Research Center (director: TSUJII Junichi); the Japan Professional Football League (chairperson: MURAI Mitsuru); and the football clubs FC Imabari, Montedio Yamagata, Hokkaido Consadole Sapporo, Kawasaki Frontale, FC Tokyo, and Kashiwa Reysol.
Carbon dioxide concentrations were measured in the spectator seating, restrooms, and concourse/gate areas in 5 different stadiums while spectators were present. We found that, under these conditions (stadium occupancy 9–46%), the stadiums were sufficiently well-ventilated, with CO2 concentrations measured at 29 locations across the spectator seating where spectators spend the most time ranging from 400 to 700 ppm. Conversely, we found that at the gates and in restrooms of the Japan National Stadium, while there were significant variations depending on time and location, CO2 concentrations regularly exceeded 1000 ppm. Even though spectators spent only a short amount of time in these locations, we think that possible methods to control the flow of people might be considered. We found that on the concourses of the Japan National Stadium during the Levain Cup Final, with the exception of when spectators were leaving at the end of the match, the most congested (i.e., crowded and people in close contact) period was 1 hour before the start of the match. We hope that these findings can contribute towards guidelines for the prevention of infection, evaluation of infection risk, and evaluation of the effectiveness of preventative measures for spectator sports at stadiums and other arenas.This first report contains the entire contents of the investigation, including stadium CO2 concentrations and the lidar measurements used to determine stadium congestion.
Societal background
With no clear end to the COVID-19 pandemic in sight, understanding how to safely hold events and under what conditions the risk of infection is high are both crucial and a matter of great social concern. Particularly for events held in large facilities like stadiums, there are concerns regarding the extent to which differences in the number of spectators, mask wearing, congestion, and spectator behavior during matches, e.g., cheering, can affect the spread of infection when large numbers of people are gathered in one place.
In devising future preventative measures, the following are important: understanding whether the actions of spectators, players, and stadium personnel during matches at stadiums and in clubhouses are likely to result in occurrence of the Three Cs; understanding spectator behavior, such as mask wearing to prevent spread of airborne droplets; and verifying there is adherence to preventative protocols. Carbon dioxide concentration is an important yardstick that can be used for avoiding the Three Cs in a given location. However, while CO2 concentrations in baseball stadiums have been measured to assess the risk of infection in spectator-occupied stadiums, no studies have yet analyzed this information in combination with data on close contact and crowd congestion gathered using lidar and image/audio sensors.
Study background
To investigate spectator behavior and whether the actions of spectators, players, and stadium personnel during matches at stadiums and in clubhouses creates an environment likely to result in the manifestation of the Three Cs and to be able represent adherence to anti-COVID protocols in an objective, numerical manner, AIST cooperated with the J.League and J.League clubs in conducting tests to measure the manifestation of the Three Cs. These tests were conducted in spectator areas in spectator-occupied stadiums, including seating, concourses, and restrooms; in player and stadium personnel areas including locker rooms, referee changing rooms, and management offices; and in clubhouse meeting rooms, changing rooms, training rooms, and staff rooms.
Study details
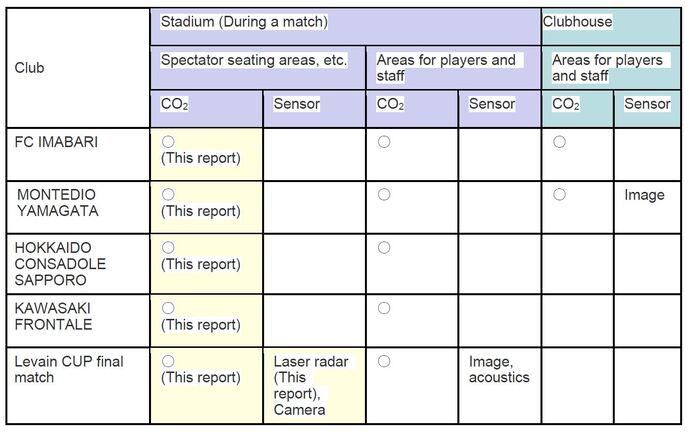
Measurements were taken during the Levain Cup Final (Japan National Stadium) and during 7 matches at 5 stadiums: FC Imabari (Arigatou Service Yume Stadium), Montedio Yamagata (ND Soft Stadium), Hokkaido Consadole Sapporo (Sapporo Dome), Kawasaki Frontale (Kawasaki Todoroki Stadium) (stadium occupancy 9–46%: Table 1). Carbon dioxide measuring devices were set up to measure CO2 as an indicator of crowd congestion and closed spaces during match time. In addition, lidar, image and audio sensors, which can be used (Fig. 1) to monitor crowd congestion, close contact, and spectator behavior, were set up within the stadium to monitor social distancing, mask wearing, and behavior during matches, e.g., cheering, of spectators and within player/personnel areas to monitor social distancing and conversation levels of players and stadium personnel in locker rooms, etc. With the cooperation of Montedio Yamagata and FC Imabari, we also measured CO2 concentrations and used image sensors within their respective clubhouses (Table 2).
Table 1: Matches observed, number of spectators, and stadium occupancy
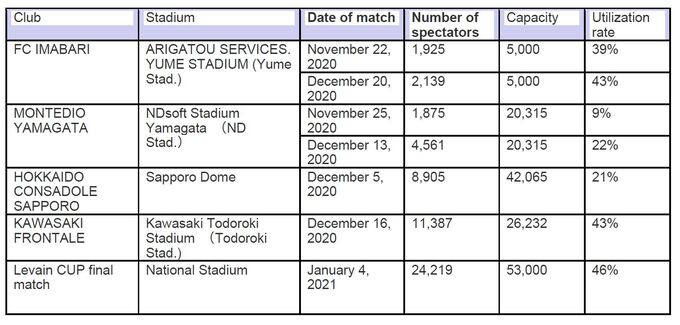
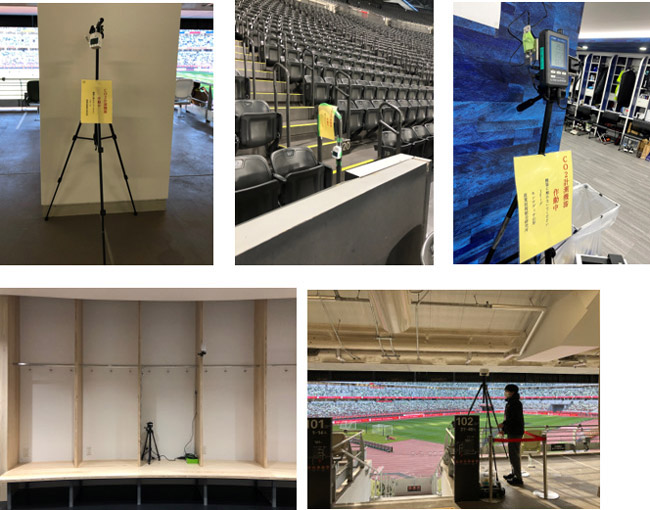
Fig. 1: Top: CO2 measuring devices in situ (Left: Japan National Stadium concourse; Middle: Sapporo Dome spectator seating; Right: ND Soft Stadium player locker room); Bottom left: Audio sensor installed at the Japan National Stadium; Bottom right: Lidar installed at the Japan National Stadium
Table 2: Equipment installed at each stadium/clubhouse
Results (CO2 concentrations)
Measurement data obtained from 29 locations in the spectator seating stands of 5 stadiums showed CO2 concentrations of 400–700 ppm (Fig. 2). At the Sapporo Dome, concentrations gradually increased as spectators entered, reaching a maximum of 660 ppm. At the Japan National Stadium, most locations began to show a rise in CO2 concentrations from an hour before kickoff, with the 2nd floor and 3rd floor concentrations of the southern stands showing a maximum of 600–700 ppm. At the Arigatou Service Yume Stadium, ND Soft Stadium, and Kawasaki Todoroki Stadium, while a small rise was detected during the matches, this was not a major increase from the CO2 concentrations found prior to kickoff (around 400 ppm). Thus, we found that, assuming a stadium occupancy of 9–46%, the spectator seating areas, assumed to be the most populated area during a football match, were sufficiently well-ventilated, with CO2 concentrations ranging from 40–700 ppm.
Measurement data obtained from 21 locations around the restrooms and gates/concourses of the 5 stadiums revealed that, while CO2 concentrations varied greatly over time and depended on the location, concentrations reached over 1000 ppm (Fig. 3 shows results from the Japan National Stadium). Restroom CO2 concentrations rose before kickoff, at half-time, and after the match; dropped during the match; and rose slightly during water breaks. In addition, even in the same stadium, the maximum CO2 concentration in toilets varies greatly from place to place, even within the same stadium, ranging from 420 to 2500 ppm (across 29 locations at 5 stadiums). The small, heavily used restrooms of the Japan National Stadium were found to be especially prone to rising CO2 concentrations. It can be surmised, however, that these restrooms were maintained with a regular rate of ventilation, with the air changes per hour, estimated from the change in CO2 concentrations, found to be 4–8 times.
Carbon dioxide concentrations at the entrance gates rose particularly following the match at Kashiwa Reysol’s stadium on the side nearest Sendagaya station. This is explained by the fact that before a match, spectators arrive in a dispersed manner, but when leaving, the spectators leave en masse, with the stadium gates nearest Sendagaya station found to be particularly crowded.
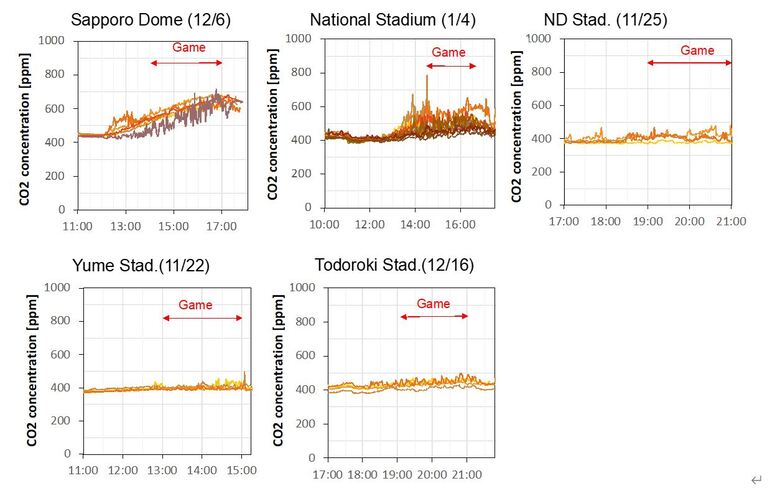
Fig. 2: Changes in CO2 concentrations in spectator seating areas (line colors indicate different data collection locations)
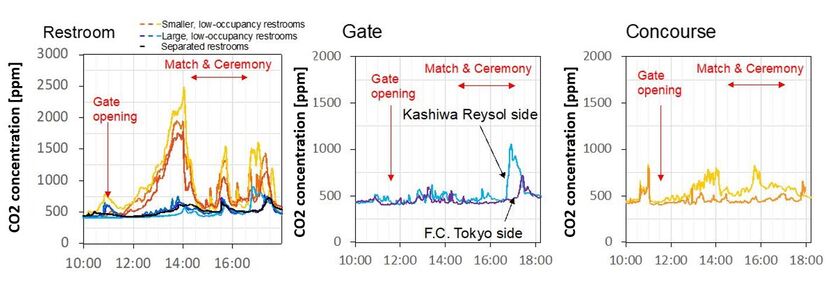
Fig. 3: Changes in CO2 concentrations at Japan National Stadium restrooms, gates, and concourses (line color indicates different data collection locations)
Results of congestion study using lidar
At the Japan National Stadium during the final of the Levain Cup (Fig. 4), we measured how many people could be detected within a 2-meter radius of each spectator in spectator seating areas. After calculating the average number people present at each point in time (Fig. 5), we found that the number of people began to steadily rise as the venue opened, with congestion on the concourses used by spectators peaking 60 minutes before kickoff, then gradually decreasing as kickoff approached, reaching a maximum after the match had concluded. Furthermore, we found that the concourse of the winning team became congested 30 minutes later than that of the losing team. These lidar results correlate with the changes in CO2 concentrations found near the gates (Fig. 3).
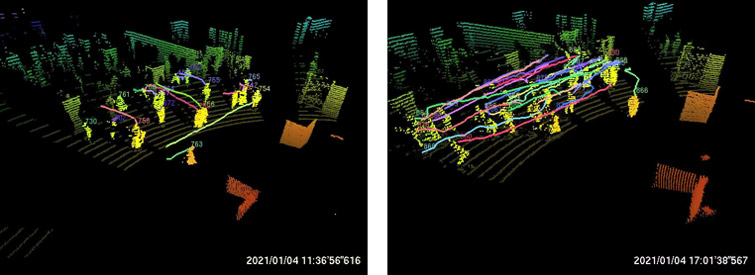
Fig. 4: Detection of people at concourse using lidar (Left: Pre-kickoff; Right: Post-match; Lines indicate a person’s detected path. The pillars in the bottom right and wall in the top-middle are represented in 3D.)
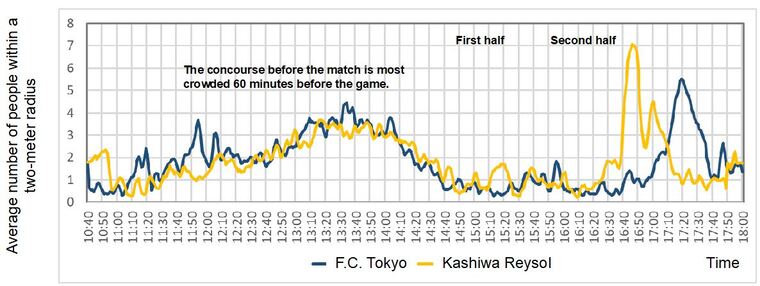
Fig. 5: Change in average number of people within a 2-meter radius of each spectator on the two concourses of the opposing teams
This report contains the CO2 concentrations at the spectator seating, restrooms, and concourse/gate areas of 5 different stadiums and data obtained from using lidar at the Japan National Stadium gates. From the results, we found restroom and gate areas that had periods of high CO2 concentrations. We also confirmed from data obtained using that there was congestion around the gates. We found that even though spectators spend a small amount of time in these areas, they are still temporarily in close contact, and therefore it is desirable to consider measures to control the flow of people. We hope that these findings can i)contribute towards the development of guidelines for large-scale events at stadiums and other venues; ii)help in evaluating the possible risks of COVID-19 infection; iii)and assist in evaluating the effectiveness of specific countermeasures.
Future plans
Going forward, we will conduct a comprehensive analysis that combines data obtained using CO2 detectors, lidar, and image and audio sensors. Furthermore, in addition to looking at stadium seating and concourses, we will also evaluate congestion and human activity in player and stadium personnel areas, including locker rooms and clubhouses. The intention being to use all the data gathered to evaluate COVID-19 risks and assess preventative measures in stadiums and clubhouses.
Research history
Since October 2020, AIST has been working with the J.League and J.League clubs to conduct investigation in areas used by spectators, such as stadium seats, concourses, and restrooms. For information about the implementation status and results of field tests we have conducted so far, see below.
Note
This report is available in Japanese on January 12, 2021. Here is the English version of the same content.
Contact address
National Institute of Advanced Industrial Science and Technology (AIST)
Institute for Geo-Resources and Environment Research, Resource Geochemistry Research Group
Research group director: Tetsuo Yasutaka, E-mail: t.yasutaka*aist.go.jp (* change to @)
Research Institute of Science for Safety and Sustainability, Risk Evaluation Strategy Group
Research group director: Wataru Naito, E-mail: w-naito*aist.go.jp (* change to @)
Artificial Intelligence and Research Center, Social Intelligence Research Team
Rsearch team director: Masaki Onishi, E-mail: onishi-masaki*aist.go.jp (* change to @)