Update(MM/DD/YYYY):05/16/2011
Determination of Age and Growth Rate of Marine Ferromanganese Crust
- Reconstruction of geomagnetic reversal records at the world's finest scale of 0.1 mm -
Points
-
Magnetic measurements were conducted on thin sections of a marine ferromanganese crust at ultra-high resolution.
-
Detailed age and growth rate of the ferromanganese crust were determined by correlating the magnetic signatures with the standard geomagnetic reversal timescale.
-
It is expected that the understanding of growth mechanism of ferromanganese crusts would lead to the detailed reconstruction of long-term history of the Earth's environment.
Summary
Hirokuni Oda (Senior Researcher) and Masato Joshima (former Senior Researcher), Paleogeodynamics Research Group (Leader: Toshitsugu Yamazaki), and Isoji Miyagi (Senior Researcher), Geodynamics Research Group (Leader: Jun-ichi Ito), Institute of Geology and Geoinformation (Director: Chikao Kurimoto) of the National Institute of Advanced Industrial Science and Technology (AIST; President: Tamotsu Nomakuchi), and Akira Usui (Professor), Faculty of Natural Sciences, Department of Education (Director: Kazuhiko Suzuki), Kochi University (President: Yusuke Sagara) determined the age and the growth rate of a ferromanganese crust based on the past geomagnetic field recorded on the crust together with Massachusetts Institute of Technology (MIT) and Vanderbilt University, the United States.
The outcome is accomplished by scanning the surface of thin sections of the ferromanganese crust at the world's finest scale of 0.1 mm utilizing a “SQUID microscope” with a superconducting quantum interference device and correlating the results with the standard geomagnetic reversal timescale (Fig. 1). The results will be published in March issue of American scientific journal, Geology.
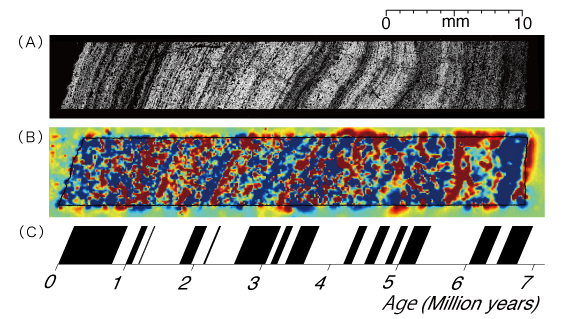 |
Figure 1: Results of analysis on a ferromanganese crust sample recovered from the sea bottom of the northwest Pacific.
(A) Backscattered electron image. Stripes observed as gradation show growth layers indicating the synchronous time lines. (B) Magnetic field observed on the surface of the crust with SQUID microscope. Blue and red denote downward and upward directing magnetic fields, respectively. (C) Standard geomagnetic reversal timescale. Black and white denote normal and reversed polarity periods, respectively. |
Social Background of Research
Ferromanganese crusts retain long-term environmental records of ocean and climate over tens of millions of years and the precise determination of their formation age is crucial to the detailed reconstruction of the past environment of the Earth. Until now, radiometric age dating methods are used based on beryllium etc., however, these methods need laborious and time-consuming process of chemical separation and isotope analysis with an accelerator mass spectrometer. Thus, a new reliable age and growth rate determination method without time-consuming process was awaited.
History of Research
AIST has carried out marine mineral exploration in the Pacific with research vessels, Hakurei-maru and Hakurei-maru-No.2, starting from 1974 during the period of former Geological Survey of Japan, Agency of Industrial Science and Technology. In addition, AIST has been undertaking a continental shelf project since 2004 in response to United Nations Convention on the Law of the Sea, in order to accumulate scientific data to define the outer limits of the continental shelf together with the other research institutes in Japan. Based on these scientific data, the participants of the continental shelf project are responding to the examination by the United Nations on the Japanese application of the outer limits of the continental shelf and continuing research on geology and mineral resources of the corresponding area.
Through these explorations, a lot of ferromanganese crust block samples were collected from all over the Pacific. However, the determination processes of the age and the growth rate of the crusts was not easy. Age determination based on isotopic analysis of beryllium etc. requires time-consuming chemical separation and an accelerator mass spectrometer. Therefore, only limited number of samples can be processed. Considering the situation, Masato Joshima and Akira Usui carried out the measurements of magnetic field on thin sliced samples taken from the crust in 1998. However, the spacial resolution is limited to around several millimeters and the geomagnetic reversals shorter than the resolution could not be detected. A group of researchers at Vanderbilt University developed a SQUID microscope which enable magnetic mapping with the finest scale at room temperature under atmospheric pressure and has been using the equipment for the research on biological functions. A research group at MIT utilized the SQUID microscope for the research on magnetic analysis of meteorites and volcanic rocks and has been accumulating the know-how about the measurements and analyses.
Thus, AIST, Kochi University, and MIT conducted magnetic analyses on a ferromanganese crust with the SQUID microscope at Vanderbilt University and estimated the age and the growth rate of the crust.
This research is supported by a Grant-in-Aid for Scientific Research from JSPS (21654071) entitled “Confirmation of supernova explosion by iodine-129 and age estimation by magnetostratigraphy”. The high quality thin sections prepared for the scanning with the SQUID microscope and an electron microscope were made by the technical staff with excellent technique at Geological Museum, AIST.
Details of Research
The research realized the detection of records of geomagnetic reversals retained as magnetic signals in the ferromanganese crust with the SQUID microscope by scanning the surface of thin sections of the crust at the resolution of 0.1 mm and enabled the estimation of the age and the growth rate by correlating the magnetic signals with the standard geomagnetic reversal timescale.
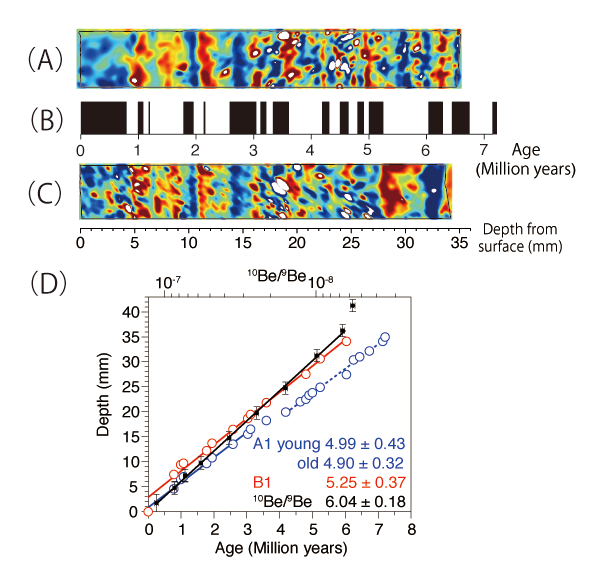
The ferromanganese crust, which was developed on the surface of basement rocks, was taken from Shotoku seamount in the northwest Pacific as part of the joint research with the University of Hawaii etc. Figure 2 shows backscattered electron images of thin sections A1 and B1 that are perpendicular to each other. The magnetic fields of the thin sections were measured with the SQUID microscope (Fig.3), and image processing was conducted to straighten the meandering growth patterns after the removal of noise from the raw data (Fig. 4 A and C). By correlating the polarity boundaries of the magnetic images (zero crossing lines) with the standard geomagnetic reversal timescale (Fig. 4B), the age of each zero crossing line was estimated and the growth rate can be calculated. The average growth rate was estimated as 5.1mm per million years based on the measurements of two thin sections A1 and B1. The beryllium isotope analysis of the same ferromanganese crust provided the growth rate estimate of 6.0 mm per million years, which is almost consistent with the estimate based on the magnetic method.
 |
|
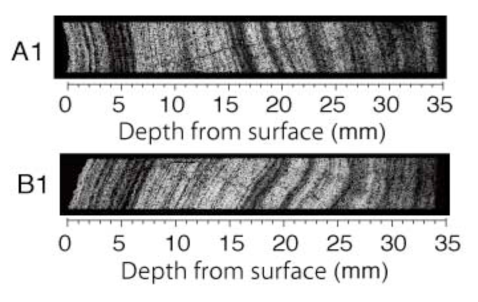
Figure 2 : Backscattered electron images of thin sections A1 and B1 perpendicular to each other, which were cut from a ferromanganese crust dredged from Shotoku seamount. Gradations of the images show the growth layers. |
 |
|
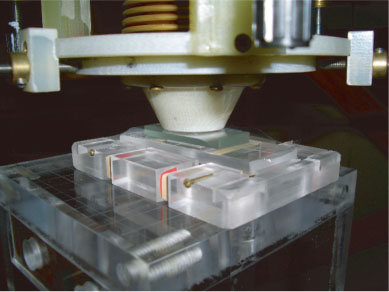
Figure 3 : A photo around a magnetic sensing part and a sample stage of the SQUID microscope at Vanderbilt University. A thin section of ferromanganese crust is covered with a Mylar film. The surface of the thin section is only 0.17 mm away from the magnetic sensor (SQUID pick-up coil). Inside the SQUID microscope is high vacuum and at low temperature (~ -269°C), whereas the sample can be measured at room temperature under atmospheric pressure. |
 |
|
Figure 4 : (A) Color image of thin section A1. Noise was removed from the raw magnetic field map and the image was straightened according to the growth pattern recognized in a backscattered electron image. Blue and red indicate upward and downward directing magnetic fields, respectively. (B) Standard geomagnetic reversal timescale. Black denotes normal polarity periods and white denotes reversed polarity periods. (C) Color image of thin section B1 after the same data processing as that for thin section A1. (D) A diagram of growth rates of the ferromanganese crust. Ordinate is depth from the surface and abscissa is the age. Blue is the growth rate obtained from thin section A1 and red indicates the growth rate from thin section B1. Black denotes the growth rate estimated from beryllium isotope analysis. Written colored inscription shows the growth rate (mm per million years) of each line, respectively. |
Future Plans
We are planning to develop and introduce a SQUID microscope to AIST in order to clarify growth process of ferromanganese crusts quickly and in detail. The equipment may make it easy for us to reconstruct long-term environmental change of the Earth.