The Environmental Exposure Modeling Team (Team Leader: Haruyuki Higashino) at the Research Center for Chemical Risk Management (Director: Junko Nakanishi) of the National Institute of Advanced Industrial Science and Technology (President: Hiroyuki Yoshikawa) (hereinafter referred to as AIST) has developed the latest version (version 2) of the Atmospheric Dispersion Model for Exposure and Risk Management (ADMER) designed to estimate the distribution of regional atmospheric concentrations of chemical substances and the exposure to populations. The new version will be downloadable for free beginning on Jan. 11, 2007 at http://en-admer.aist-riss.jp/.
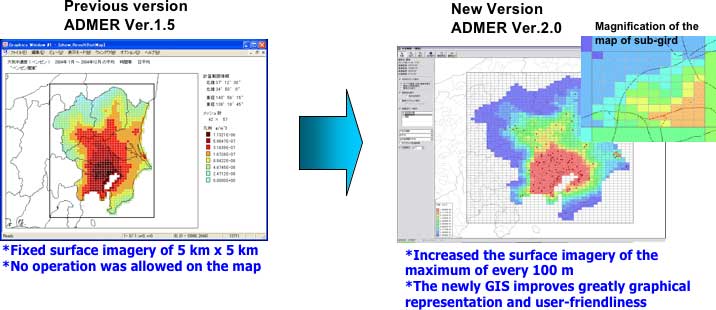
The new version is primarily characterized by the increased resolution. This version has a built-in function to analyze subgrids that will assist many users in their analysis of small areas such as cities, wards, towns, and villages. This function increased the surface imagery considerably from every 5 km to the maximum of every 100 m. At the same time, this version has improved graphics and is very user friendly in addition to this built-in function that automatically downloads necessary data for analysis, such as meteorology reports, population figures, and traffic. It has also been improved to satisfy needs of current users, and can now calculate the average concentration of a given pollutant by city, ward, town, or village automatically. (Figure 1)
The workshop of this newly developed software will be given to 100 people for free at Tokyo Big Sight on January 22, 2007. You can submit an application for the workshop via http://www.safe.nite.go.jp/risk/entry.html.
 |
|
Figure 1. Remarkable feature of ADMER Ver.2.0 |
The exposure and risk of chemical substances have traditionally been assessed only on the basis of observational data, but it costs a tremendous amount of money and labor to assess them by only observing a region and the diversity of substances. To remedy this, a software package called ADMER has been developed to calculate the atmospheric concentrations of chemical substances from emissions and meteorological conditions. The official name of ADMER is the National Institute of Advanced Industrial Science and Technology - Atmospheric Dispersion Model for Exposure and Risk Management: AIST-ADMER.
The number of users of ADMER has been on the rise year by year thanks to its availability and user-friendliness, along with the availability of emissions data of chemical substances that have become available due to the enforcement of the Pollutant Release and Transfer Register (PRTR). In fact, ADMER is being used by various organizations in their efforts to assess the risk of atmospheric chemical substances.
The previous version received various requests from users as its popularity increased, with the request for higher surface imagery being most notable. The previous version had a fixed surface imagery of 5 km × 5 km that was suitable for the observation of a distribution on a regional scale like the entire Kanto area. A higher resolution is naturally more desirable for the observation of a specific area like a prefecture or municipality.
The previous version gave a calculated value lower than actual measurements because of its limited resolution, particularly when the target point was close to the source origin. For example, when we compared the values given by ADMER with the values actually measured by the existing observation station, we found that the former tended to be smaller because the distance between the source origin and the observation station was smaller than the grid interval, particularly when the target area was a relatively small outer city. A higher resolution is vital for representing this kind of area.
For this reason, using ADMER together with a dispersion model for concentration estimates near the observation station like the METI-Low-rise Industrial Source Dispersion model (METI-LIS) was needed for producing accurate values for small areas. However, concurrent use makes this operation more complicated, the calculation time longer, and the calculation more voluminous, making it impossible to estimate exposure population.
ADMER has been available to the public on the website of the Research Center for Chemical Risk Management of the National Institute of AIST since 2003, and is downloadable for free. It is one of the most popular programs of its kind with more than 2,000 users. ADMER is one of the representative products of the Comprehensive Chemical Substance Assessment and Management Program at the New Energy and Industrial Technology Development Organization (hereinafter referred to as NEDO). Actually, the program uses primarily ADMER for its assessments of the initial and detailed risks of gaseous substances. In addition, the nation and municipalities use it to work out environmental policies, as do various organizations including educational institutions and private companies.
Exposure and risk of chemical substances have traditionally been assessed only on the basis of observable data, but ADMER allows for assessment based on data from the source. This newly-developed function increased the number of assessable areas and substances substantially. At the same time, it has become possible to estimate the contributing rate of sources (a quantitative assessment of what a source contributes to the concentration and related risk), create an estimate for a new substance without observable data, and analyze factors indispensable to socioeconomic assessments.
As a matter of fact, the concurrent use of observable data and ADMER has allowed for the analysis of the contributing rate of a source and the effects of reducing the rate. This greatly affected the final report on the discussion on future voluntary management of hazardous air pollutants at the Industrial Structure Council.
The development of ADMER was part of the research projects “Development of Risk Assessment and Assessment Method”, and “Analysis of Effects of Risk Reduction by Management Policy” entrusted by the NEDO.
Although the increase in ADMER’s resolution is vital to increasing the analytical accuracy for a small area, increased surface imagery naturally means longer calculation times and increased data volumes. Accordingly, if the resolution is increased simply by making the grid interval of the analysis area smaller, it will be hard to use ADMER for the estimation of concentration distributions and exposure to populations in a big area like all of Japan, which is one of ADMER’s major characteristics.
Instead of increasing ADMER’s surface imagery of the whole area, the decision was made to develop a module that makes the detailed analysis of a specific area possible. In addition to this new feature, the new version has been given the representational function and improved user-friendliness brought about by the geographical information system (GIS) with the various improvements to satisfy users’ requests.
(1) Function for analyzing subgrids
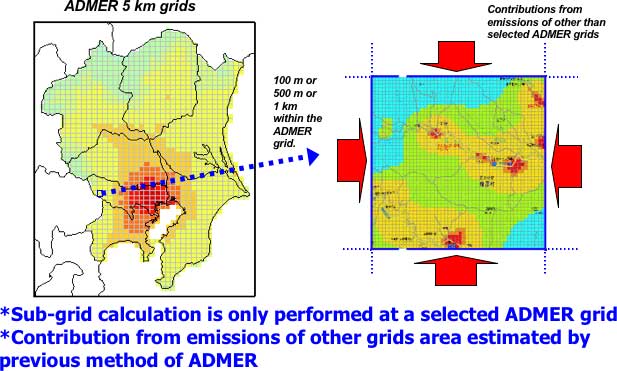
As shown in Figure 2, one can select a specific small grid (a 5 km × 5 km grid) that the existing ADMER can then analyze at a high resolution by using the newly-developed subgrid module, and continue the calculation to estimate concentration distributions by dividing the 5 km × 5 km grid into a grid with dimensions ranging from 100 m to 1 km. You can calculate values at the 5 km resolution, as in the past, in terms of the influence of a remote source that does not require a high degree of accuracy in the analysis. This built-in function has provided higher surface imagery and increased the efficiency of the calculation times and data volumes simultaneously.
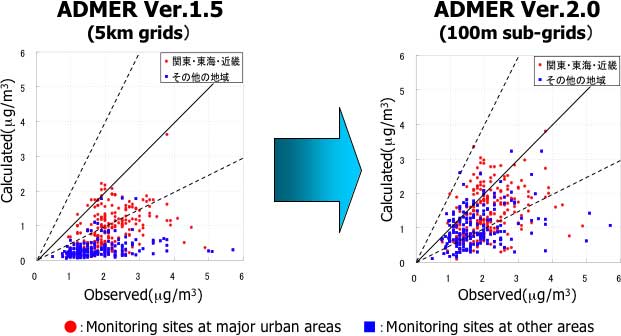
This new function increases the accuracy dramatically for outer cities with relatively low concentrations as sources and areas along roads that have close proximity between the source and assessment point. (Figure 3)
 |
|
Figure 2. Schematic diagram of the method of sub-grid calculation |
 |
|
Figure 3. A comparison of the observed and the modeled annual mean concentration of benzene |
(2) Graphical representation by GIS
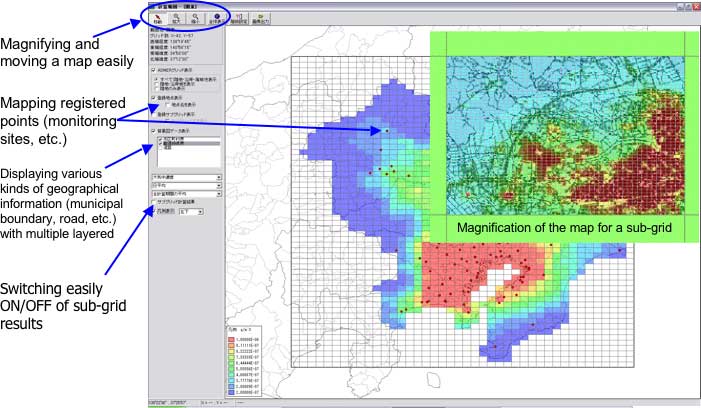
The newly-incorporated GIS improves greatly ADMER’s graphical representation and user-friendliness, making it possible to magnify, demagnify, and move a map, register observation points in advance and display them, and display various kinds of background images as layers (boundaries of administrations, roads, etc.) (Figure 4)
 |
|
Figure 4. New GIS component of the ADMER ver.2.0 |
(3) Automatic downloading of necessary data for analysis
ADMER sets up grids for analyzing various statistical and meteorological data, such as populations, land utilization, and traffic to create emission rates per grid and estimate the exposure to the population. Major data of these kinds are incorporated in ADMER, and the new version is equipped with a function to update them by acquiring the latest data via download from the ADMER website.
(4) Automatic calculation of average concentration by municipality
ADMER manages emissions and concentrations using a grid. In response to a request from users to know the average value of a municipality, it now has the function to tally the value of each grid and automatically calculate the average emissions and concentrations for each municipality.
Efforts will be made to spread ADMER through workshops. The first workshop for ADMER version 2.0 is scheduled for Jan. 22, 2007 at Tokyo Big Sight. Up to 100 people will be invited for free. Those who are interested in the workshop are requested to file an application on the Internet at http://www.safe.nite.go.jp/risk/entry.html.
It is anticipated that the new version of ADMER will spread the assessment of exposure and risk of pollutants to the national and municipal levels, helping the rational monitoring plan and chemical substance management policies develop on a relatively small scale.