- Opening the doorway to clarification of the relationship between structures and functions of nano-crystals -
The National Institute of Advanced Industrial Science and Technology (AIST; Hiroyuki Yoshikawa, President) and Tohoku University (Takashi Yoshimoto, President) have theoretically and experimentally analyzed the crystal nucleation process and the subsequent crystal growth process in the colloidal synthesis of CdSe quantum dots, and succeeded in clarification of the relationship among crystal size, crystal structure, and optical absorption spectra in the primary process of the crystal growth.
Until now, the relationship between the function and the size or structure of quantum dots has been unclear. However, by synthesizing them at temperatures lower than those for conventional methods (below 200°C), the reaction rates were slowed (approximately 40 min), enabling the tracking of the reaction process using optical absorption spectra.
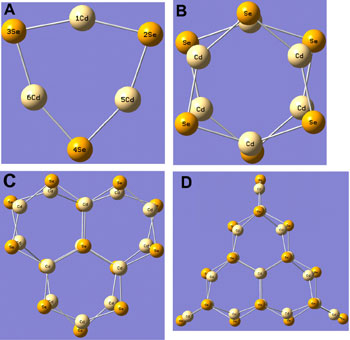
We have clearly identified the initial nucleation followed by growth of quantum dot crystals, and moreover clarified the relationship between crystal structures in nucleation and growth, and the optical absorption spectra with the technique of computational chemistry. Crystal structures predicted with a calculation method are shown in Figure 1.
To design and fabricate nano-scale electronic materials, it is very important to understand adequately the relationship between the nano-crystal structures realized physically and their functions. In the current work, we have clarified the relationship not only between the crystal size and the wavelength of the absorbed light, but also between the crystal structure and the absorption spectra, thereby enabling the establishment of a method of evaluation of the relationship between the structures and the functions of the nano-crystals. The current work was published in the Journal of the American Chemical Society (February, 2006).
 |
|
Figure 1. Crystal structures of CdSe predicted with theoretical calculations and found to be physically reasonable. (A) (CdSe)3, (B) (CdSe)6, (C) (CdSe)13, and (D) (CdSe)16.
|
The Health Technology Research Center has developed technologies for real-time imaging of single biomolecules to serve medical diagnosis by detecting disease-related biomolecules. We have developed quantum dot technologies in part of our project, "Development of fluorescent labeling techniques for visualization of biomolecules."
The Nano-Bioanalysis Team has carried out study on the preparation of fluorescent semiconductor quantum dots such as CdSe, and developed techniques for the labeling of biomolecules and visualization of bio-cells using the quantum dots since 2002, when the former Single-Molecule Bio-Analysis Laboratory was established. We found not only new applications of biomolecules labeled with quantum dots but also a novel synthesis method of quantum dots (patent No. 2004-129843). Furthermore, using the method, we have succeeded in producing quantum dots with novel physical properties useful for fluorescent probes. The current work was supported by the Grant-in-Aid for Scientific Research (KAKENHI) in Priority Area "Molecular Nano Dynamics" from Ministry of Education, Culture, Sports, Science, and Technology, Japan.
 |
|
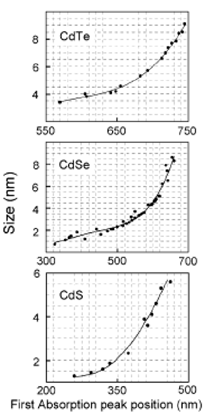
Figure 2. Calibration curves of diameter against absorption maxima for three representative quantum dots (Yu, W. W., Qu, L., Guo, W. Peng, X. Chem. Matter 2003, 15, 2854)
|
It is empirically known that there is a correlation between the sizes of semiconductor quantum dots prepared using a colloidal synthesis method and their absorption maxima, which are observed at the long-wavelength region and called the HOMO-LUMO transitions. A summary of the results is shown in Figure 2 as calibration curves of size against absorption maxima. However, because of the lack of information on their structures, the relationship among the size of quantum dots, their structures, and functions has remained unclear. For example, one report suggests that CdSe quantum dots of approximately 2 nm in diameter consist of approximately 75 CdSe units; on the other hand another report suggests 37-125 CdSe units in a 2-nm diameter crystal. Thus, this difference in the number of CdSe units indicates that the number of CdSe units is not uniquely determined solely by specifying the size of quantum dots.
In the current work, we have predicted the structures of quantum dots with a method of computational chemistry, and have further shown that the predicted structures are physically reasonable for the following reasons. (i) The HOMO-LUMO transitions for the predicted structures agree well with those determined experimentally, and (ii) the crystal sizes that are consistent with the energy of HOMO-LUMO transitions agree well with the sizes of the calculated crystal structures. For example, we have identified that CdSe quantum dots of ~2 nm in diameter consist of 16 CdSe units.
[Preparation of CdSe quantum dots]
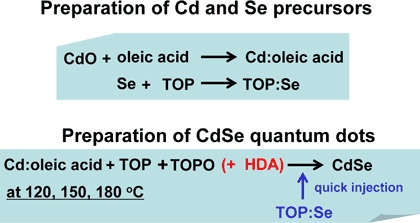
First, a Cd precursor (Cd: oleic acid) was prepared by dissolving cadmium oxide into oleic acid (CH3(CH2)7CH=CH(CH2)7COOH). A selenium precursor (TOP: Se) was prepared by dissolving Se into trioctylphosphine oxide (TOP: [CH3(CH2)7]3P), which is a coordination solvent. Next, Cd: oleic acid was mixed with a mixture of TOP and trioctylphosphine oxide (TOPO: [CH3(CH2)7]3PO), which is another coordination solvent.
The precursor TOP: Se was quickly injected into this mixed solution and stirred. We have also examined the difference between the reaction with and without the other coordination solvent, hexadecylamine (HDA: CH3(CH2)15NH2) in the mixed solution of Cd: oleic acid, TOP: Se, TOP, and TOPO. The reaction was carried out at 120, 150, and 180°C under an argon atmosphere to prevent oxidization and ignition of the solution. In early colloidal synthesis methods, HDA was not used, ; however, it was found that the addition of HDA enhances photo-luminescence efficiency. The preparation procedure of CdSe quantum dots is summarized in Figure 3.
 |
|
Figure 3
|
[Experimental results]
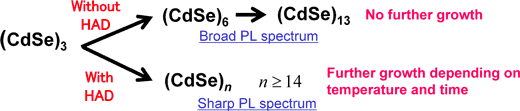
For both with and without HDA, the nucleus of the CdSe quantum dot is (CdSe)3. However, the subsequent crystal structures depend on whether HDA is used or not. Without HDA, the subsequent structure is (CdSe)6, which grows into (CdSe)13, while with HAD, the structure formed after (CdSe)3 is (CdSe)14, which grows further with increasing temperature and time.
It has been unclear why the crystal growth process depends on with and without HAD. This dependence may be due to a difference in the caged structure formed by coordination solvent molecules within which crystal nuclei were trapped. Furthermore, we found that the number of CdSe units determines whether the crystals are photo-luminescent or not, and whether the photo-luminescence spectra are sharp or broad. The nucleus (CdSe)3 is not photo-luminescent, probably because the excitons are not formed for this size.
Photo-luminescence spectra due to excitons are inherently sharp. On the other hand, for sizes larger than (CdSe)14, sharp spectra are observed, because the photo-luminescence due to excitons is predominant. Broad spectra are observed for sizes smaller than (CdSe)13. This may be due to lone electron pairs of Se atoms present on the crystal surface. The lone electron pairs can be characterized by the performance of strong interactions with coordination solvents. The experimental results are shown in Figure 4. In addition, absorption and photo-luminescence spectra (120(space)°C) with HDA and without HAD are shown in Figures 5 and 6, respectively. Figure 7 shows formation of crystal nuclei and subsequent growth of the crystal (120, 150 and 180(space)°C) with HDA, and Figure 8 shows a schematic illustration of the nucleus formation and the subsequent growth of the crystals.
 |
|
Figure 4
|
 |
|
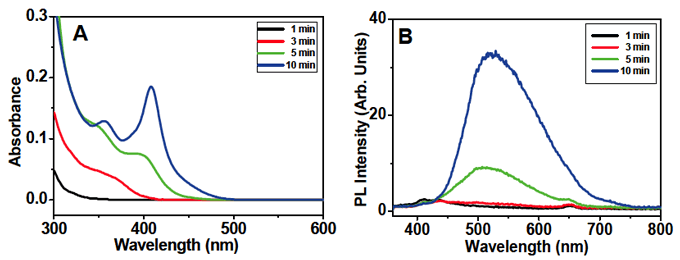
Figure 5 (A) Time-dependence of absorption spectra of CdSe quantum dots synthesized with TOP and TOPO but without HDA at 120°C, and (B) corresponding photo-luminescence spectra. The number of CdSe units is estimated to be 3 at 3 min, 6 at 5 min, and 13 at 10 min.
|
 |
|
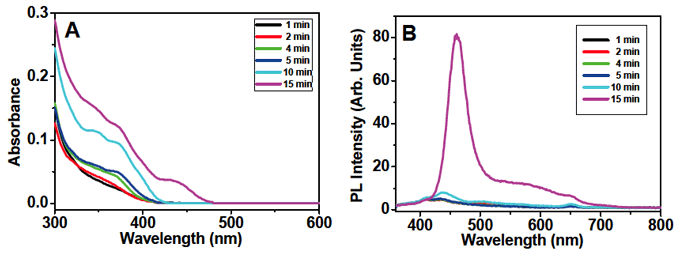
Figure 6 (A) Time-dependence of absorption spectra of CdSe quantum dots synthesized by the addition of HDA into TOP and TOPO at 120°C, and (B) the corresponding photo-luminescence spectra. The number of CdSe units is estimated to be 3 at 3, 5, and 10 min, and 14 at 15 min. With HDA, the number of the CdSe unit next to 3 is 14 or more ; however, 6 units, which appeared without HDA, is not found. The change in absorption spectra between 0 and 10 min show the process in which the number of the nucleus (CdSe)3 increases. In the photo-luminescence spectra, we found sharp peaks due to the direct recombination of the excitons at the short wavelength region and broad photo-luminescence from a trapped level at the longer wavelength region. The broad photo-luminescence almost disappears at 180°C.
|
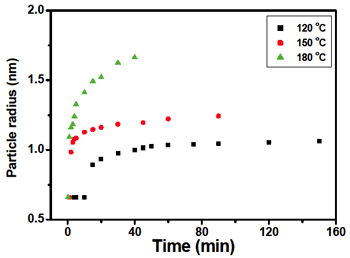
Figure 7 Temperature-dependence of the initial nucleus formation followed by the growth of CdSe quantum dot crystals synthesized with the addition of TOP, TOPO and HDA. The diameter of the crystals was determined from the calibration curve in Figure 2 using the HOMO-LUMO transitions.
|
|
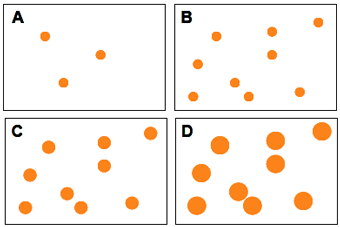
Figure 8 A schematic illustration of the initial formation of crystal nuclei, an increase in the number of crystal nuclei, and subsequent growth of crystal nuclei. The number of nuclei increases from A to B ; however, their size is constant during this period. From B to C and D, the size increases ; however, the number of nuclei is constant
|
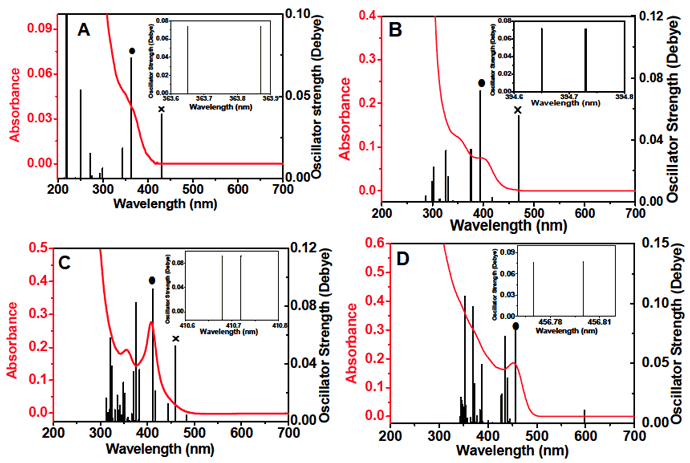
As in Figure 9, results calculated for crystals not larger than (CdSe)13 show that a transition (X) with a relatively strong oscillator-strength appears in the wavelength region longer than that of the HOMO-LUMO transition (●). The longer wavelength transition is believed to be due to lone electron pairs of Se atoms on the surface of the crystals. Figure 9 also shows that for crystal sizes larger than (CdSe)13 the longer wavelength transition disappears, thus suggesting that the contribution from the Se atoms on the crystal surface will be small with increasing crystal size.
[Calculation procedures]
(i) Crystal structures of model CdSe are optimized to be energy minimal. From the optimized crystal structures, the diameters of the crystals are estimated.
(ii) Infrared absorption spectra are calculated from the normal oscillations of the optimized structures. If the calculated frequencies are negative, the corresponding structures are not adopted, while if they are positive, the corresponding structures are adopted.
(iii) With the structures adopted above, oscillator strengths (f) of the transition to excited states, whose number is limited to several tens at the largest, depending on the computer capabilities, are calculated and classified into f <0.02, 0.02 < f <0.06, and 0.06 < fo f for convenience.
(iv) The HOMO-LUMO transition can be identified from transitions of 0.06 < f.
(v) First, the diameter of crystals corresponding to the identified HOMO-LUMO transitions wavelength is estimated using the calibration curve in Figure 2. Then, whether the diameter is almost consistent with that estimated theoretically is confirmed.
[Identification of HOMO-LUMO transitions]
(a) The HOMO-LUMO transitions corresponding to the diameters of the optimized crystal structures are estimated using the calibration curve in Figure 2.
(b) The calculated transitions (f > 0.06) whose transition energies are close to those estimated above are searched.
(c) It is checked whether the transition found above shows a doublet structure, which is composed of two oscillators with the same intensity whose energies are close to each other (< 3 meV).
(d) If the doublet structure is found, the transition is identified as the HOMO-LUMO transition.
 |
|
Figure 9 Experimental absorption spectra and calculated oscillator-strength distribution. (A) Without HDA, 3 min, 120(space)°C: (B) without HDA, 5 min, 120(space)°C; (C) without HDA, 10 min, 120(space)°C; (D) with HDA, 2 min, 150(space)°C. The number of CdSe units involved is 3, 6, 13, and 16, respectively. The HOMO-LUMO transition is denoted by (●). The transition due to lone electron pairs of Se atoms is denoted by (X). The inset of each figure shows that the HOMO-LUMO transition shows a doublet structure. |