Dr. Kazuhiro Kojima, a researcher at the Intelligent Systems Research Institute (ISRI), of the National Institute of Advanced Industrial Science and Technology (AIST), an independent administrative institution, has developed an organization structure analysis program based on a leading-edge network theory, and applied it to the AIST to identify key personal relationship essential for organizational structure and coordination, of which overall picture has been difficult to grab.
The ISRI-AIST has developed an organization structure analysis program based on the "Complex Network" theory, attracting broad attentions in these days, to analyze the structure of an organization and to figure out various linkages in and out of the organization. As an illustrative application, the research outcome data of the AIST have been examined by using the developed program to analyze linkages among researchers and research areas.
The AIST is one of the largest research organizations in Japan holding 2,500 full-time researchers, and it is of interest to trace out linkages among individual researchers in this big institute.
In the AIST, each of researchers is requested to register every move of his/her publication at a technical conference or a science journal in a database with research title, synopsis, co-authors, publication date and so on. The analysis program will be launched in the form of co-authorship network to formulate the joint research relations among researchers in and out of the AIST, as shown in Fig. 1.
The co-authorship network is visualized in Fig. 2, where node colors correspond to six research categories in the AIST. The top-level network, "mega-network" is extracted in Fig. 3 out of Fig. 2. It is clear in Fig. 3 that each of research areas is loosely linked together while constructing cluster structures of various levels. The diagram suggests a success in building an interdisciplinary collaboration to some extent as proposed by the AIST.
In this way, the analysis program makes it possible to obtain a bird-eye view of the organization which has been hardly available up to now, and to identify important personal relations based on the computation of weight for the organization, of linkage between researchers by using "Shortest Path Betweenness" and ultimately to grasp the research trends and to provide support for research activity efficiently.
The future efforts will be directed to creating scientific and industrial maps of Japan and the world by incorporating database from outside organizations to customizing for use in private enterprises.
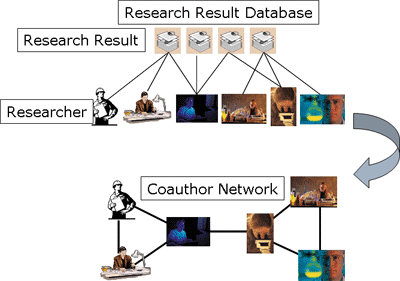 |
Fig. 1. Construction of a co-authorship network |
Recently, three moves are becoming prominent in the world of industry and economy. (1) Appropriate responses are needed to meet quick and drastic changes in and diversity of consumers' needs, (2) Shake-up of employment system from stable one based on lifetime employment to dynamic one based on part-time workers and temporary staff, and (3) Transition from fixed hierarchical organization to dynamic team organization based on project strategy. Japanese enterprises are requested to have organizational changes to keep pace with these turbulent social conditions. That is, the conventional vertical organization is to be switched to transversal network one. Under such a circumstance, it is essential for business managers and employees to grasp the overall picture, and these needs will grow further hereafter.
The ISRI-AIST has developed an organization structure analysis program to meet these requirements using the "Complex Network" theory which is attracting topical interest in these days. As an illustrative application, the program has been applied to the publication data representing the AIST's R&D activities for analyzing linkages among AIST researchers and research areas.
In the AIST, each of researchers is requested to register every move of his/her publication at a technical conference or a science journal in a database with research title, synopsis, co-authors, publication date and so on. The analysis program will be launched in the form of co-authorship network to formulate the joint research relations among researchers in and out of the AIST. The network will be represented at first by two-part graph between papers and authors, as shown in Fig. 1 top. Then, authors sharing papers are connected to create an undirected graph as shown in Fig. 1 bottom. This relation is named co-authorship network.
At present, R&D works in the AIST are carried out in six categories: 1) life science, 2) information and communications, 3) nanotechnology, materials and manufacturing, 4) environment and energy, 5) geology and oceanography, and 6) standards and measurements. In Fig. 2, the co-authorship network is created and visualized out of the AIST publication data of fiscal 2004.Individual researchers are represented by nodes, of which colors correspond to research categories concerned as listed below. Those for outside researchers with research categories not identified are not colored.
|
1.Life science (life, organism info, biotechnology)
|
Violet |
|
2.Information and communications (IT, robotics, electronics)
|
Blue |
|
3.Nanotechnology, materials, manufacturing
|
Yellow |
|
4.Environment and energy technology
|
Green |
|
5.Geology and oceanography (incl. volcano, active faults, underground resources)
|
Aquamarine |
|
6.Standards and measurements
|
Red
|
The number of researchers extracted from the database counts 7,724, consisting of 3,214 AIST people (including guest researchers and students) and 4,510 outside researchers. The computation revealed a maximum-sized network (mega network) comprising 65 % of total researchers (Fig. 3).
Fig. 4 shows the distribution of network sizes for 5-year data from fiscal 2000 to fiscal 2004. It is clear that a mega network comprising 60 to 80 % of total researchers always exists in every fiscal year, and that within a mega network for each fiscal year, research categories are loosely linked while building cluster structures. This demonstrates the success of move for interdisciplinary collaboration as pushed forward by the AIST.
These results are expected to be helpful for researchers as a supporting tool for surveying research trends around his/her specific area, or for finding partners of different categories by tracing linkages in the network. For instance, a researcher in the geological area can get contact with an appropriate partner in entirely different area such as informatics or bioscience.
Moreover, it may be possible to compute the weight of linkage based on the Shortest Path Betweenness (SPB) and to identify the significant personal relationship for organizational linkage. Fig. 5 shows the result of applying the SPB to the second largest network in the co-authorship network for fiscal 2004 (Fig. 2). Ten links with larger SPB values are represented in thick line. In Fig. 5, there are clusters of different categories, and links of interdisciplinary collaboration connecting them are given greater weight. Based on these results, it may be possible to decide the research strategy for reinforcing hetero-disciplinary linkages in the organization, for instance, allocating additional budget and personal resources to researchers with linkage of higher SPB.
In this way, the newly developed program is found to be applicable to trend survey, organizational analysis and assessment.
|
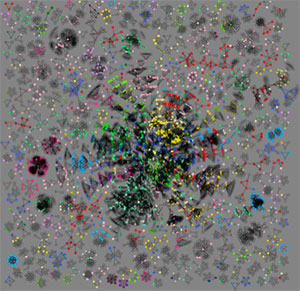
Fig. 2 Overall co-authorship network created from the publication data for fiscal 2004.
|
|
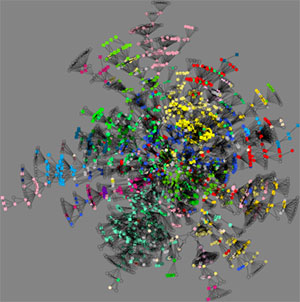
Fig. 3 Mega network extracted from the publication data for fiscal 2004 (the largest-sized network in Fig. 2).
|
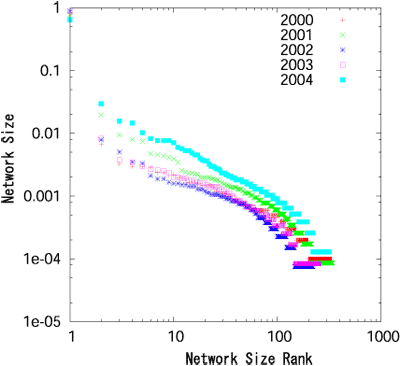
Fig. 4 Distribution of network sizes. Abscissa: array of network sizes in the decreasing order. Ordinate: ratio of network size to the number of nodes. |
|
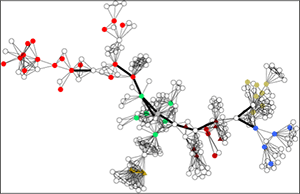
Fig. 5 Computation of SPB. Second largest network in Fig. 2. Ten links with greater SPB values are shown in thick line.
|