- Creation of a map of the atmospheric concentration of chemical substances on Google EarthTM and faster calculation -
Haruyuki Higashino (Leader), the Environmental Exposure Modeling Group, the Research Institute of Science for Safety and Sustainability (Director: Junko Nakanishi) of the National Institute of Advanced Industrial Science and Technology (AIST) (President: Hiroyuki Yoshikawa) has developed ADMER Ver. 2.5, a model to estimate extensive atmospheric concentrations of chemical substances, and distribution of exposed population. ADMER Ver. 2.5 may be freely downloaded at http://www.aist-riss.jp/software/admer/ from August 5, 2008.
AIST's Atmospheric Dispersion Model for Exposure and Risk Assessment (ADMER) is free software that can be used to calculate atmospheric concentrations of chemical substances in each area of Japan from data on emissions and meteorological conditions.
The newly released, upgraded version makes it possible to display concentrations maps on satellite photos in Google EarthTM. In addition, it has such features as enhanced calculation speeds through parallel processing, improved user-friendliness, and an in-built function to download Automated Meteorological Data Acquisition System (AMeDAS) data of the Japan Meteorological Agency. The United States began releasing atmospheric concentrations data using Google EarthTM last year, but this is the first for Japan.
 |
|
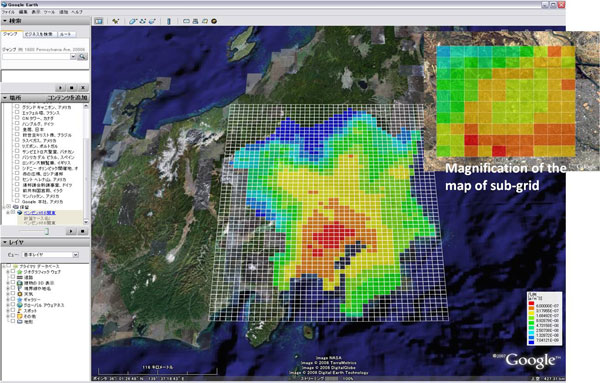
An example of displaying atmospheric benzene concentrations map on Google EarthTM
|
|
The ADMER can estimate a distribution of concentrations at the spatial resolutions of the maximum of 100 m x 100 m within the basic ADMER grid (5 km x 5 km).
|
The risk and the exposure of chemical substances have traditionally been evaluated solely using observation data. However, this would require tremendous expense and labor if many substances are to be evaluated over a large area. To solve this problem, AIST developed software to calculate atmospheric concentrations of chemical substances using released amount and meteorological data in 2002. The official name of this software is the National Institute of Advanced Industrial Science and Technology - Atmospheric Dispersion Model for Exposure and Risk Assessment (AIST-ADMER).
ADMER drastically increased the number of areas and substances that could be evaluated and made it possible to quantitatively evaluate the sources of high concentrations and associated high health risks. At the same time, it allowed for analyses indispensable to socioeconomic evaluations, such as the estimation of new substances whose observation data are not available as well as the extrapolation of estimates both into the future and into the past.
ADMER is easy to use and available free of charge to everyone. In addition, it has now become possible to obtain released amount of various chemical substances because the pollutant release and transfer register (PRTR) system has been enforced. The number of ADMER users has been increasing year on year, and ADMER is now being used by various agencies, including companies and municipalities, to evaluate the risk of exposure to atmospheric pollutants.
ADMER is one of the most popular software of its kind, accumulating over 3,000 registered users, municipalities and companies, since its release in 2003. It is one of the representative research products of the Comprehensive Chemical Substance Assessment and Management Program* of the New Energy and Industrial Technology Development Organization (NEDO). It is used for initial and detailed risk evaluation of most gaseous substances in this program. It is also used by various agencies, including governments and municipalities for policy making, educational institutes, and companies.
ADMER ver. 2.0, released in 2007, increased the maximum spatial resolution to 100 m to enable exposure evaluation in areas as small as a single municipality. However, since the map in the background must also have a sufficiently high resolution, general users have had to purchase expensive local map data.
*This research was conducted as part of "Risk analysis, development of evaluation method, and analysis of effect of management measures to decrease risk," which is a research project funded by NEDO.
align="left">The upgraded version (Ver. 2.5) has improved functions such as those for display, calculation, and automatic updating.
1. Improved display function
|
(1) Display of atmospheric concentrations maps on Google EarthTM |
|
|
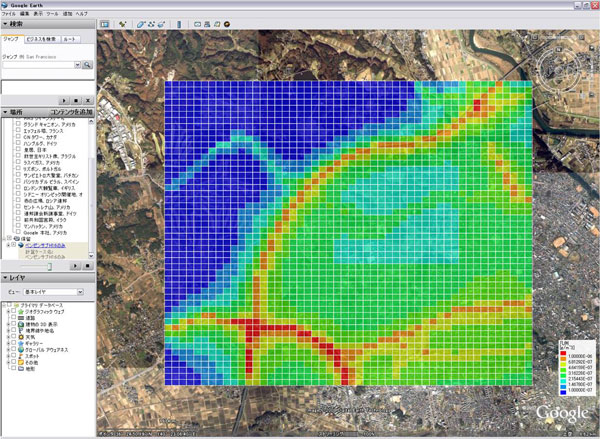
ADMER has included a map display function from the very beginning, but users had to buy detailed maps separately because the built-in background maps were rudimentary, showing only the boarders between municipalities. To solve this problem, Ver. 2.5 incorporates a function to display calculated results (concentrations map) on satellite photos in Google EarthTM. Thus, users can use detailed map data easily for free, and do not need to purchase expensive map data (Figure 1). |
 |
|
Figure 1. An example of displaying atmospheric concentrations map on Google EarthTM (square grids painted red-yellow denote high concentration areas of benzene discharged from automobiles)
|
|
(2) Improved function to register class values |
|
|
In the previous versions, users had to go through complicated operations to register a class value on the class value registration screen in a distribution map or a histogram. Now, they can register class values simply by naming the setting of the class value used for the current display on the screen. |
|
(3) Function to select class colors on a distribution map |
|
|
In the previous versions, it was impossible to change the class color of each distribution display of released amounts and atmospheric concentrations. But Ver. 2.5 makes it possible to select a color from a color table. |
2. Improved calculation function
|
(1) Introduction of parallel processing |
|
|
Ver. 2.5 is designed to be compatible with parallel processing for faster processing of the dispersion calculations for chemical substances in the atmosphere. The calculation speed is increased threefold if a commercially available PC with a Quad Core CPU is used (Figure 2). |
 |
|
Figure 2. Comparison of elapsed time between ve. r2.0 and ver. 2.5 by using the PC equipped Intel® CoreTM2 Quad 2.66GHz
|
|
(2) Introduction of a group of subgrids |
|
|
In the previous ADMER ver. 2.0, users needed to go through complicated operations to conduct a subgrid calculation, because they had to register ADMER grids one by one for the subgrid calculation. However, Ver. 2.5 makes it possible to register multiple ADMER grids (a subgrid group) all together. |
3. Improved function of automatic updating
|
(1) Function to download Automated Meteorological Data Acquisition System (AMeDAS) data |
|
|
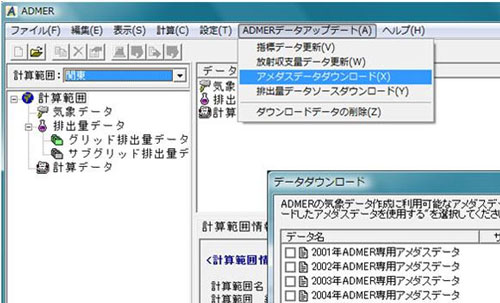
In the previous versions, users had to obtain a CD-ROM of the AMeDAS annual observations report to prepare meteorological data for ADMER. But Ver. 2.5 makes it possible to download only the necessary data in a specialized format via the Internet from AIST's ADMER website. This function enables users to prepare meteorological data for ADMER without purchasing a CD-ROM of the AMeDAS annual observation report (Figure 3). |
 |
|
Figure 3. Ver. 2.5 makes it possible to download AMeDAS data via the Internet from AIST's ADMER website
|
|
(2) Function to download data source of grid released amounts |
|
|
A function to download the data source of grid released amounts has been added. The data source of grid released amount is a set of grid released amount data complied beforehand using proper index data and released amount data for each substance. The function makes it possible to obtain proper released amount data more easily. Data sources of grid released amount will be added as necessary. |
|
(3) Function to update ADMER program |
|
|
An upgrading function is packaged in ADMER. |
We will supply meteorological data and various index data using the function to update data automatically. At the same time, we wish to promote the spread of ADMER through workshops, etc.